Abstract
Squall lines are the consequence of the interaction of low-level shear with cold pools associated with convective downdrafts. Beyond a critical shear amplitude, squall lines tend to orient themselves at an angle with respect to the low-level shear. While the mechanisms behind squall line orientation seem to be increasingly well understood, uncertainties remain on the implications of this orientation. Roca & Fiolleau 2020 show that long lived mesoscale convective systems, including squall lines, are disproportionately involved in rainfall extremes in the tropics. One may then question whether the orientation of squall lines has an impact on rainfall extremes, and if so, why.
Using a cloud-resolving model, we perform idealized simulations of tropical squall lines by imposing a vertical wind shear in radiative-convective equilibrium. Our results show that precipitation extremes in squall lines are $40\%$ more intense in the critical case and remain $30\%$ superior in the supercritical regime. With a theoretical scaling of precipitation extremes Muller 2020, we show that the condensation rates control the amplification of precipitation extremes in tropical squall lines, mainly due to its dynamic component. The critical case is not only optimal for squall line orientation, but also for the cloud base velocity intensity of new convective cells.
Theoretical Scaling
As mentioned in the introduction, our study of extreme precipitation in squall lines
is based on a theoretical scaling that allows to decompose extreme precipitation into three contributions: a thermodynamic contribution related to water vapor, a dynamic contri- bution related to the vertical mass flux in extreme updrafts and a microphysical contri- bution related to the precipitation efficiency. The latter is defined as the fraction of con- densation in a convective updraft that finally reaches the surface as precipitation. It is generally less than one because some of the condensates are either advected away as clouds, or evaporate as they fall into the unsaturated air below the cloud before reaching the surface. Each of these three contributions is subject to different theoretical constraints,
and may respond differently to to the orientation of squall lines. An overview of the ori-
gin of this theoretical scale is provided in C. Muller and Takayabu (2020). This scaling
can be written as follows
P ∼ εC ∼ ε−∂qsatρw ∂z dz
where P is the precipitation, C is the condensation rate, ε the precipitation efficiency, Ht the height of tropopause, ρ the density, w the vertical velocity, qsat the saturated spe- cific humidity and z the altitude. The precipitation efficiency is deduced by the quotient of the condensation rates over the precipitation rates following Da Silva et al. (2021).
Results
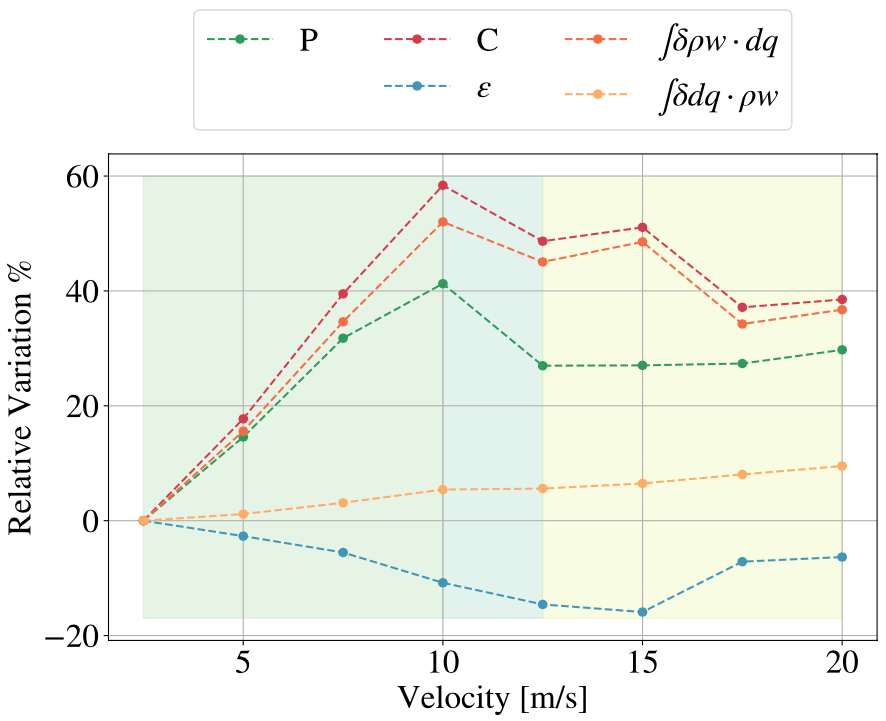
By calculating the scaling terms for each simulation, we can represent all the contributions on figure \ref{fig:decompo_all}. We have displayed the value of the extremes ($99.9\%$) of precipitation for each simulation in green, the extremes of condensation in red and the efficiency of precipitation, calculated as the residual of precipitation over condensation. In orange it is the thermodynamic contribution, where the saturation profiles have been calculated at the condensation extremes columns, and in dark orange, we have the dynamic contribution, again taken at the condensation extremes columns.
This decomposition indicates for instance that for the case $U_{sfc}=10$ m/s, the increase in precipitation extremes of $40\%$ is due to an increase in condensation of $60\%$ and a decrease in precipitation efficiency of about $15\%$ (the residual difference is due to higher order terms neglected in equation \ref{eq_relative_scaling}). Overall, in all the simulations, the variations in the condensation rate explain the variations in precipitation. Focusing on the two contributions, dynamic and thermodynamic, we notice, still for the case $U_{sfc}=10$ m/s, that when condensation increases by $60\%$, this is due to an increase of $50\%$ in dynamics, and $10\%$ in thermodynamics. In conclusion, the contribution that mainly explains change in extremes of precipitation is the dynamic contribution.

